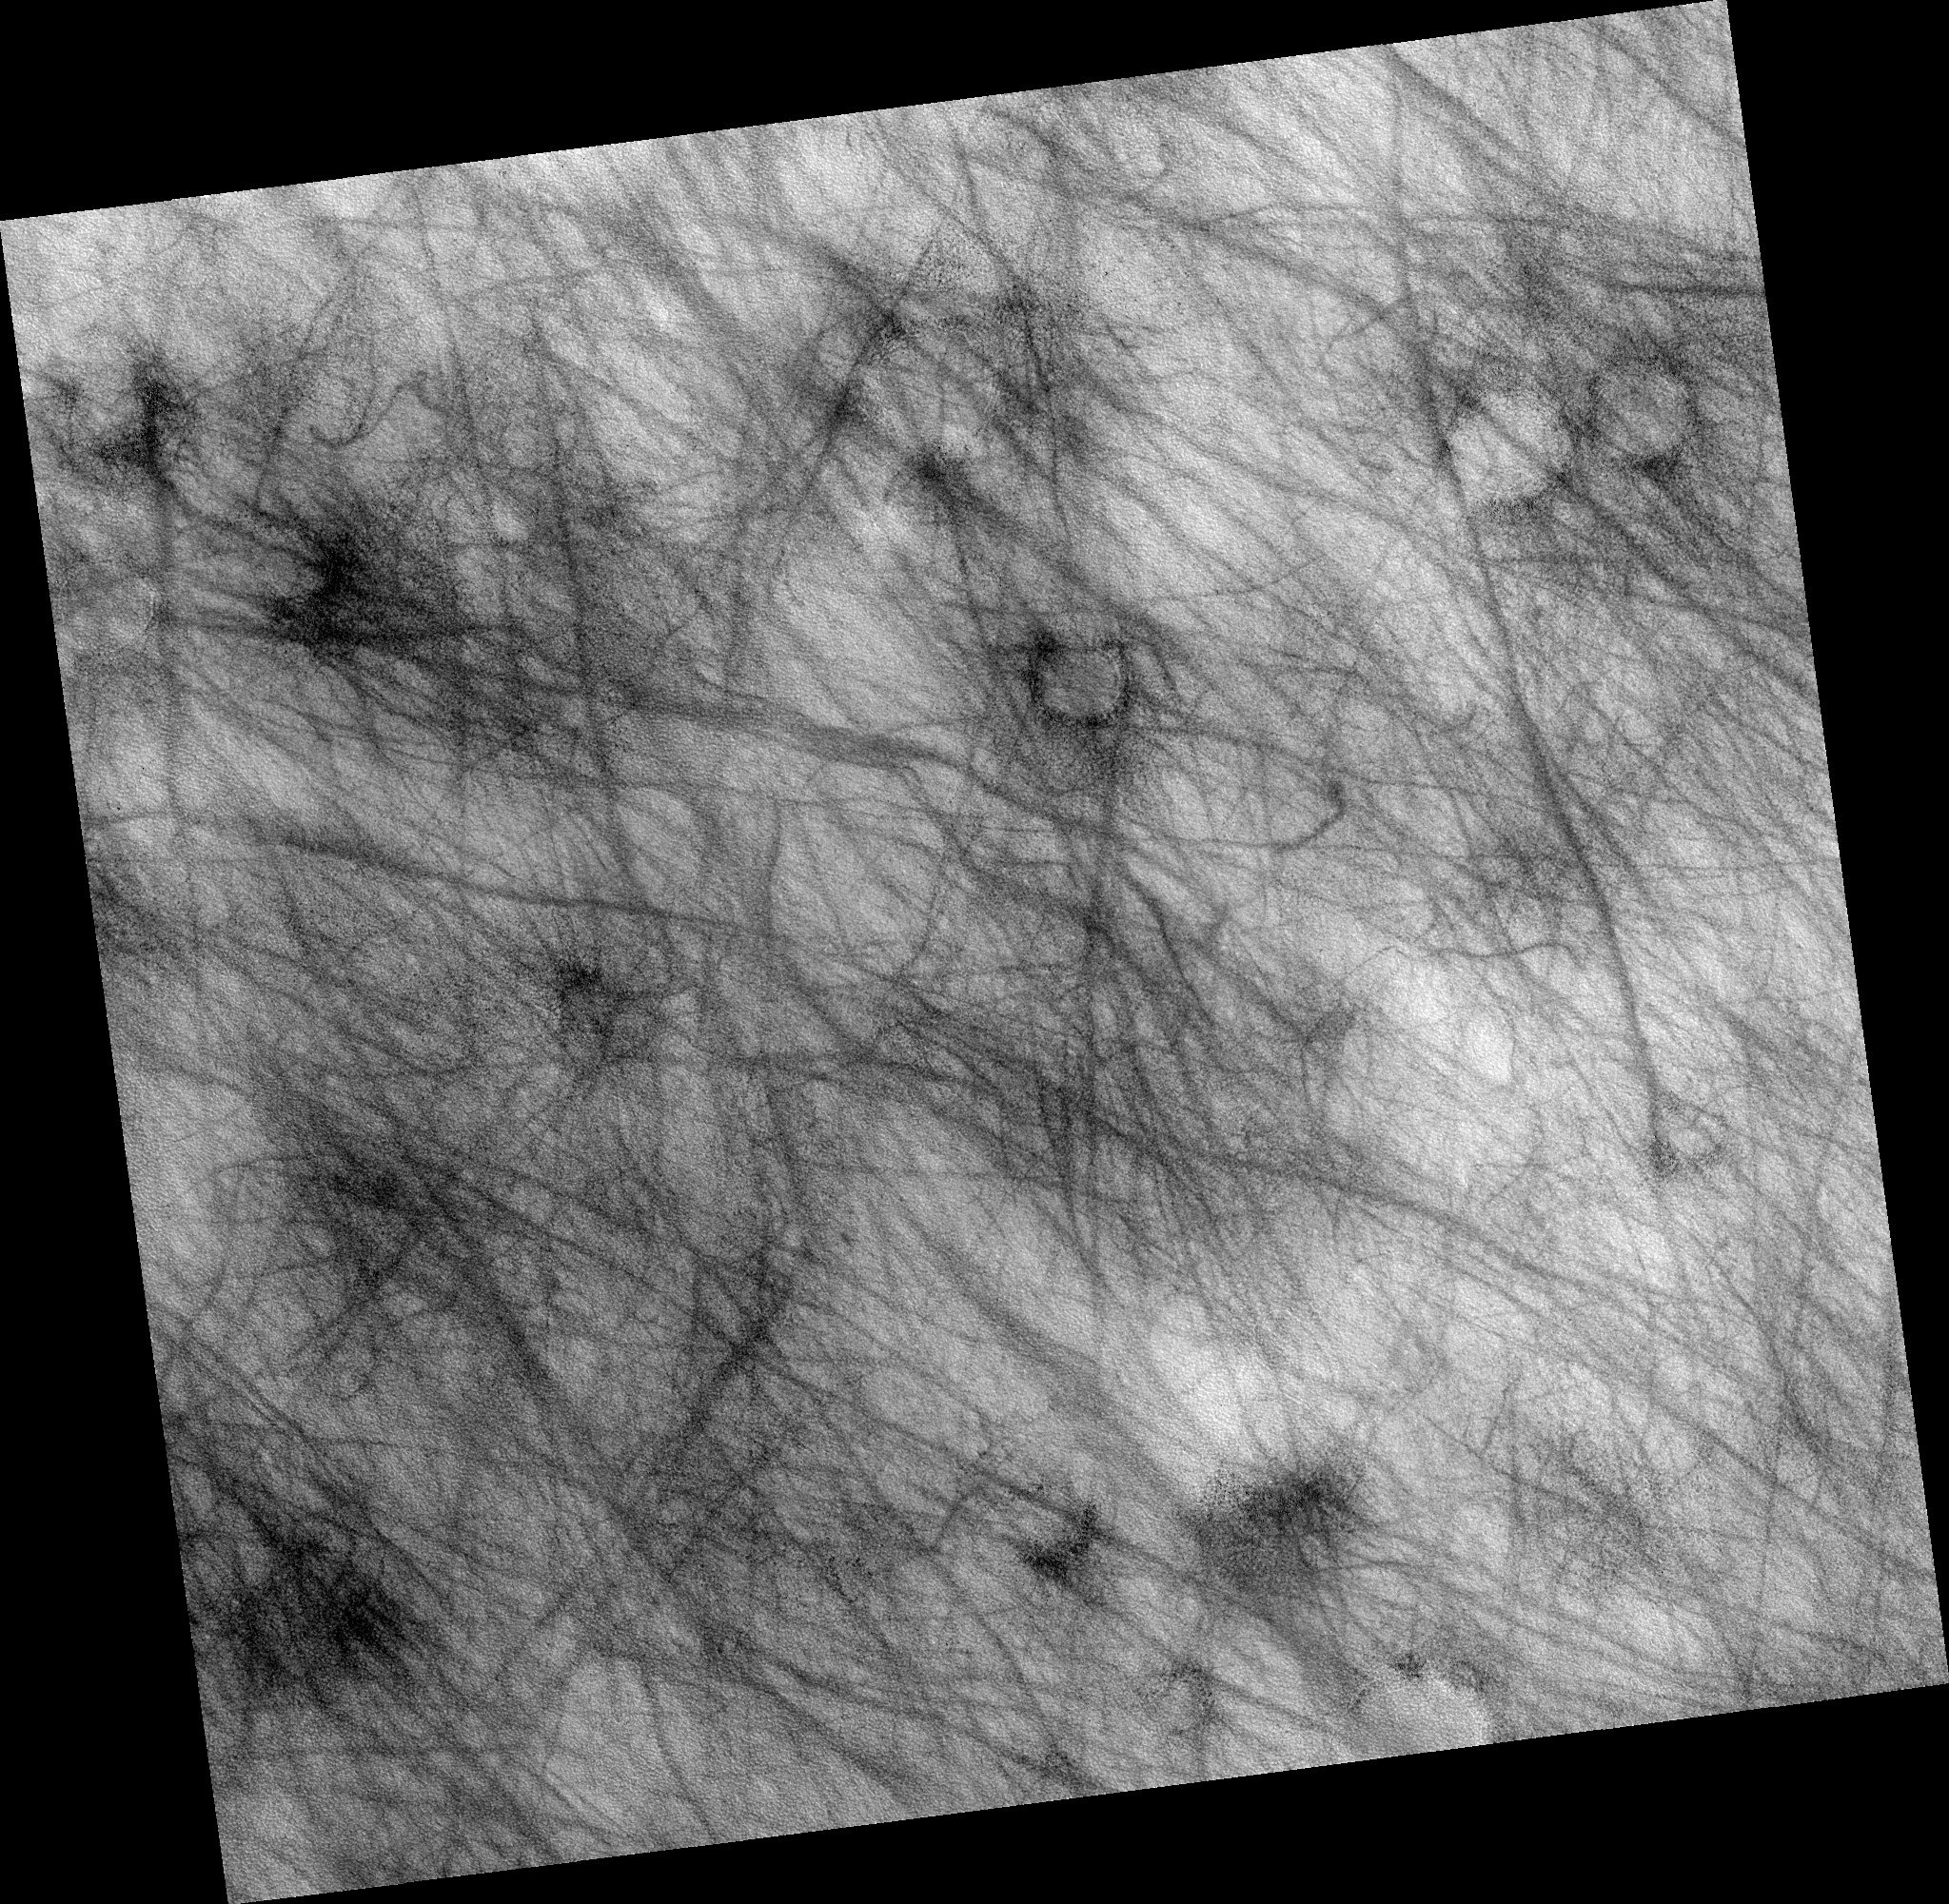
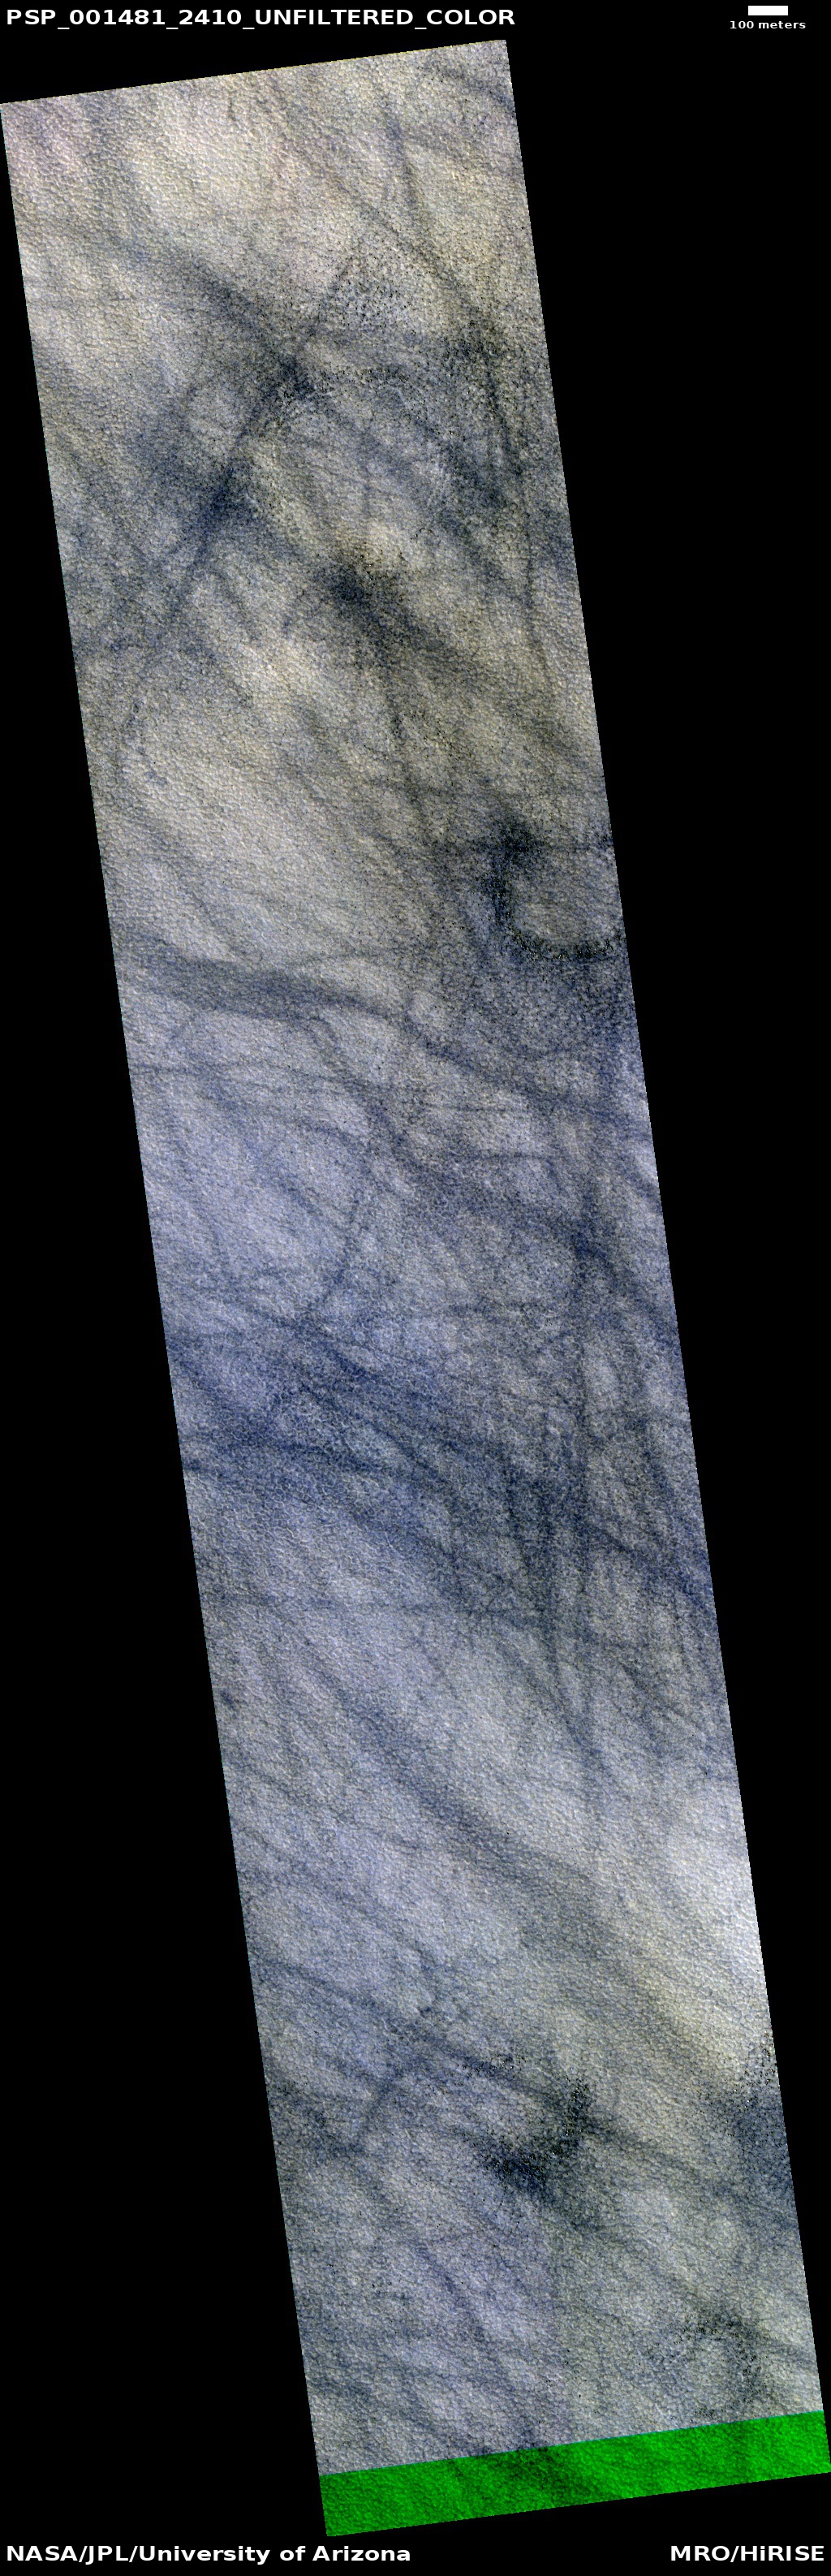
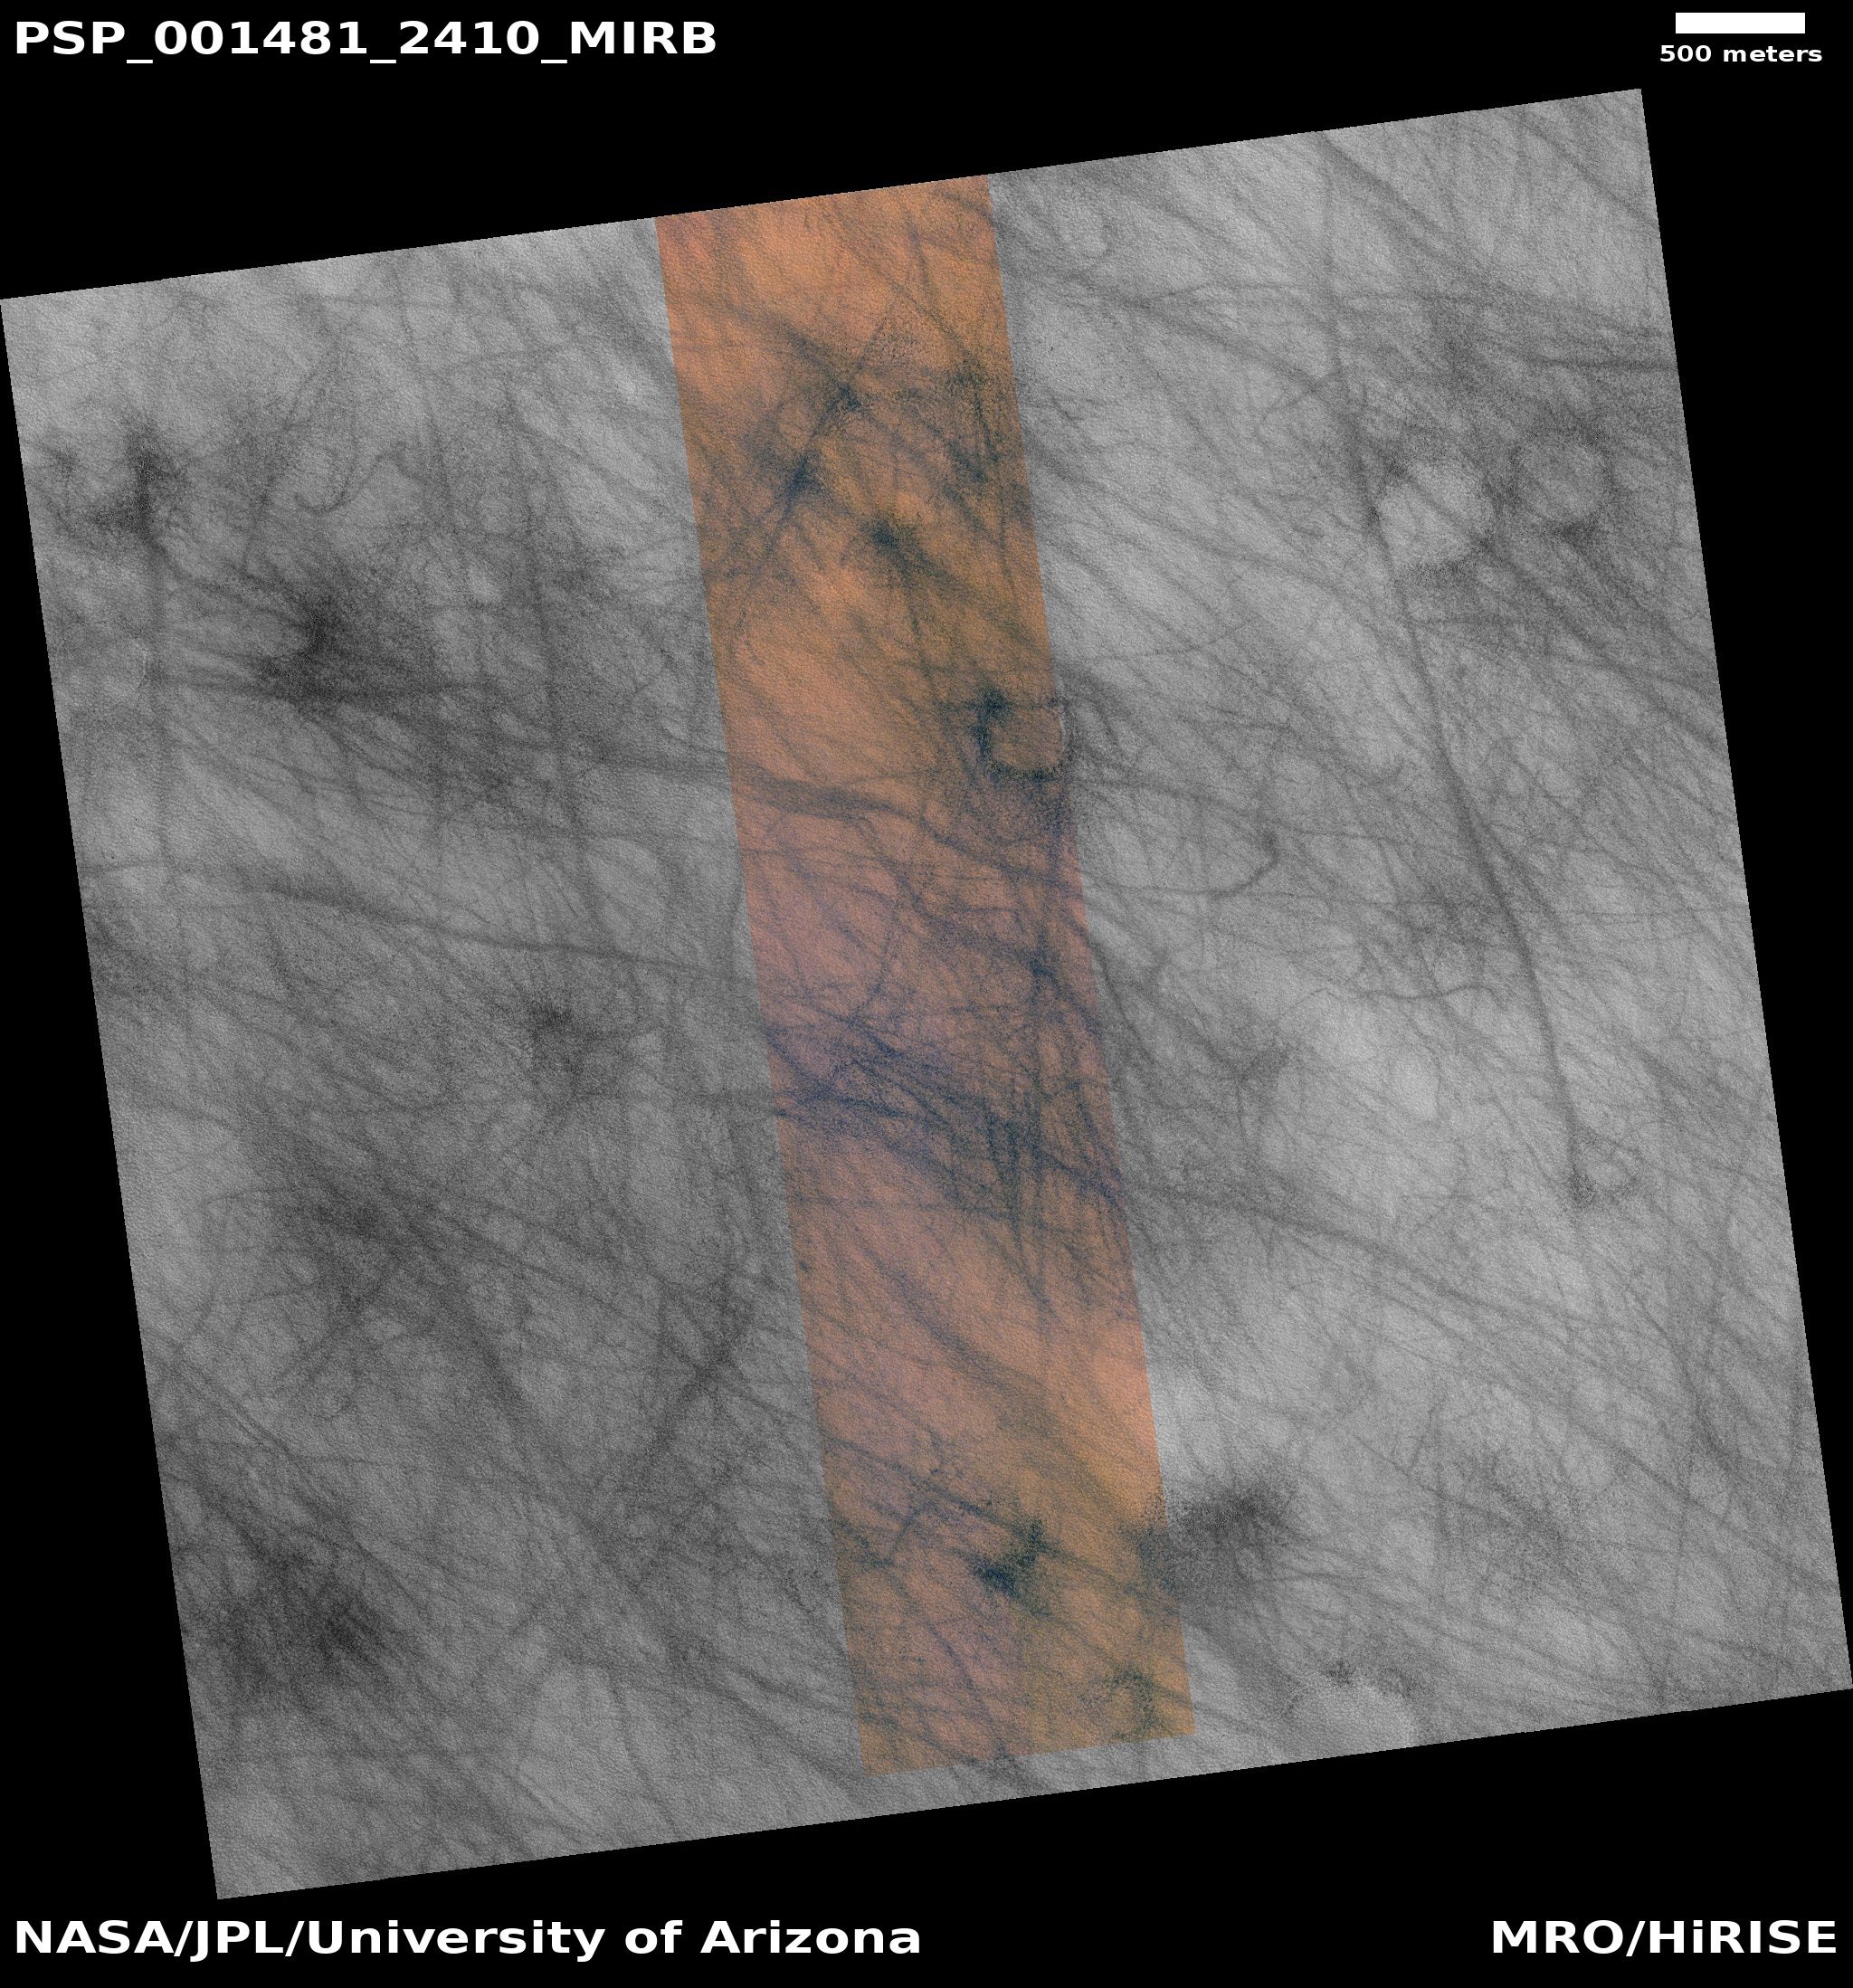
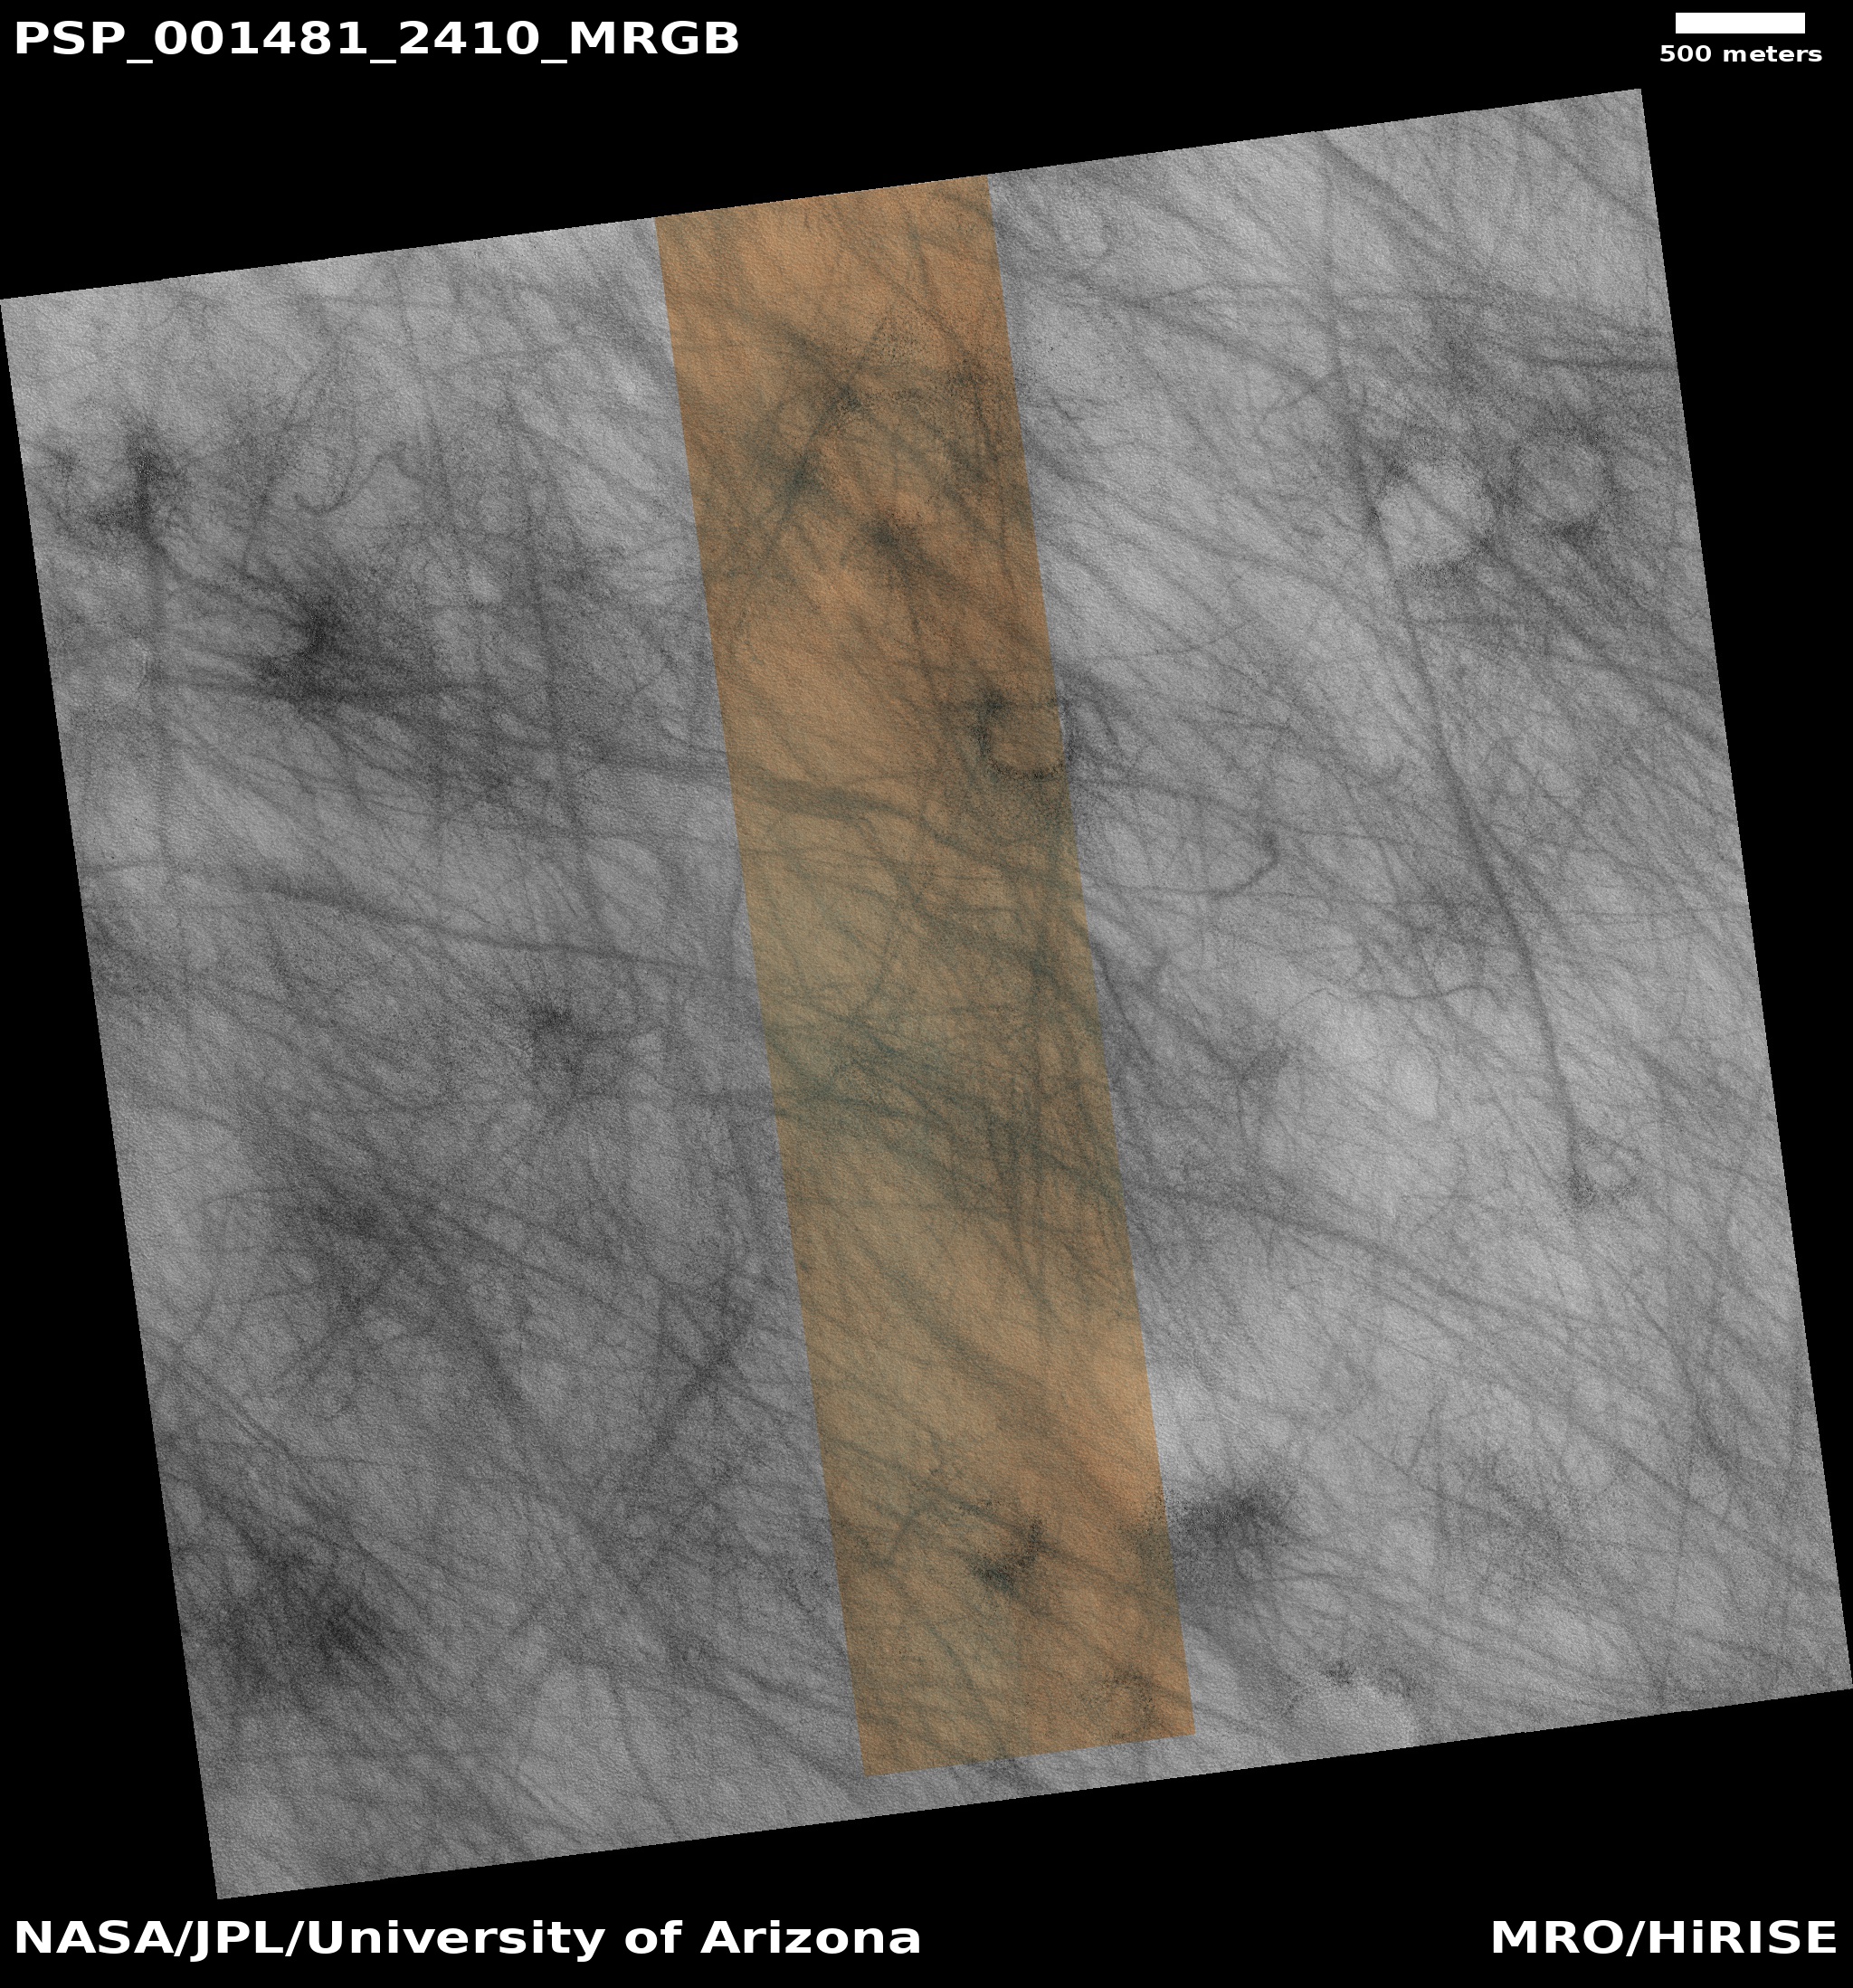
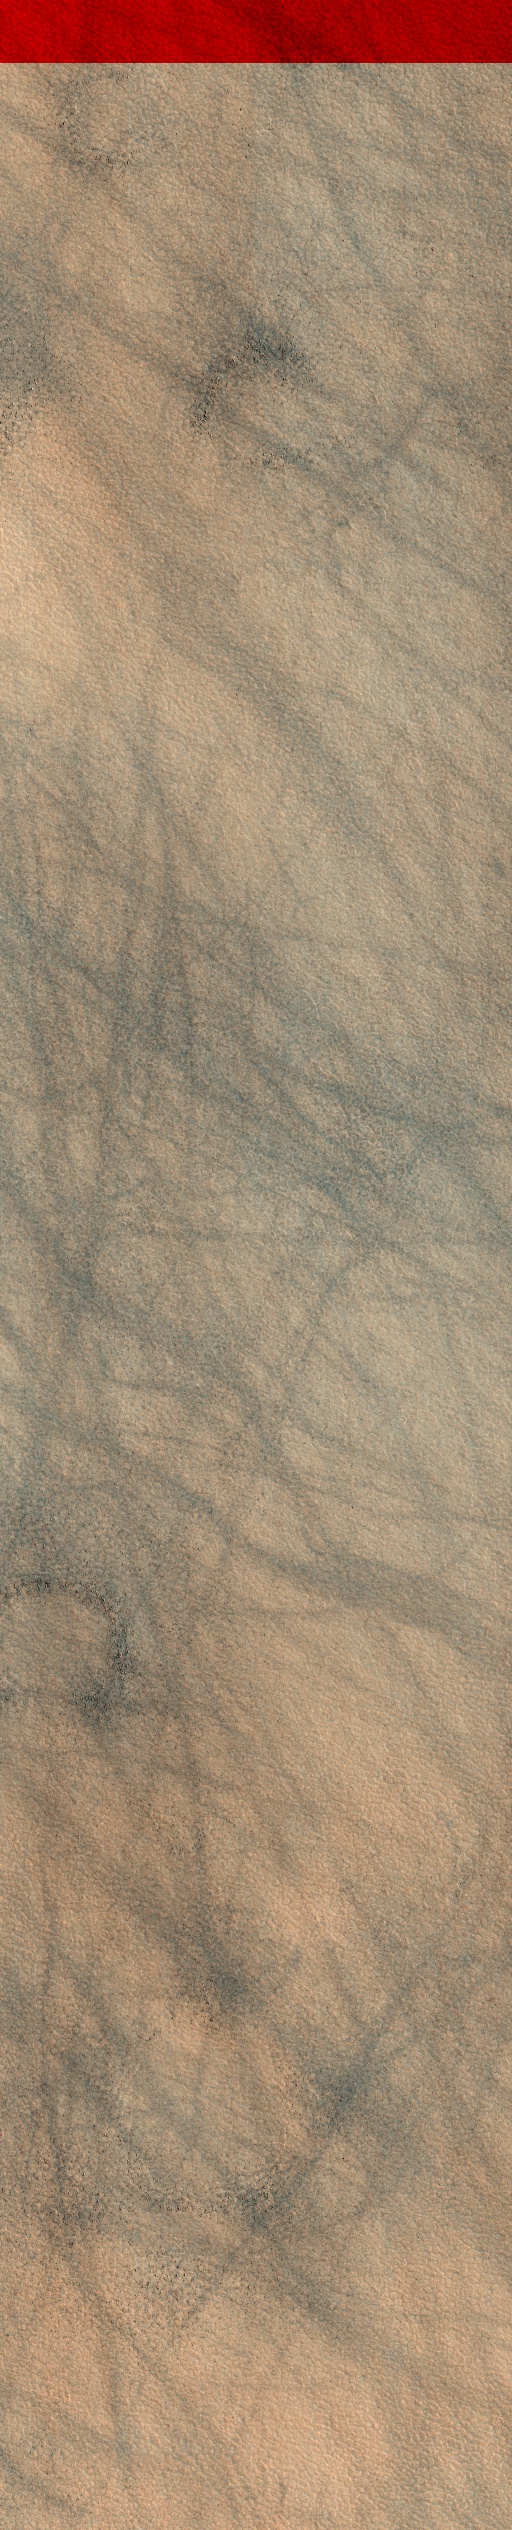
| Acquisition date 19 November 2006 Local Mars time 15:13 Latitude (centered) 60.711° Longitude (East) 318.541° Spacecraft altitude 310.2 km (192.8 miles) Original image scale range 31.0 cm/pixel (with 1 x 1 binning) so objects ~93 cm across are resolved Map projected scale 25 cm/pixel and North is up Map projection Equirectangular Emission angle 0.0° Phase angle 56.0° Solar incidence angle 56°, with the Sun about 34° above the horizon Solar longitude 137.9°, Northern Summer For non-map projected images North azimuth: 97° Sub-solar azimuth: 336.1° | JPEG Black and white map projected non-map IRB color map projected non-map Merged IRB map projected Merged RGB map projected RGB color non-map projected JP2 Black and white map-projected (571MB) IRB color map-projected (271MB) JP2 EXTRAS Black and white map-projected (199MB) non-map (250MB) IRB color map projected (54MB) non-map (214MB) Merged IRB map projected (160MB) Merged RGB map-projected (151MB) RGB color non map (191MB) |
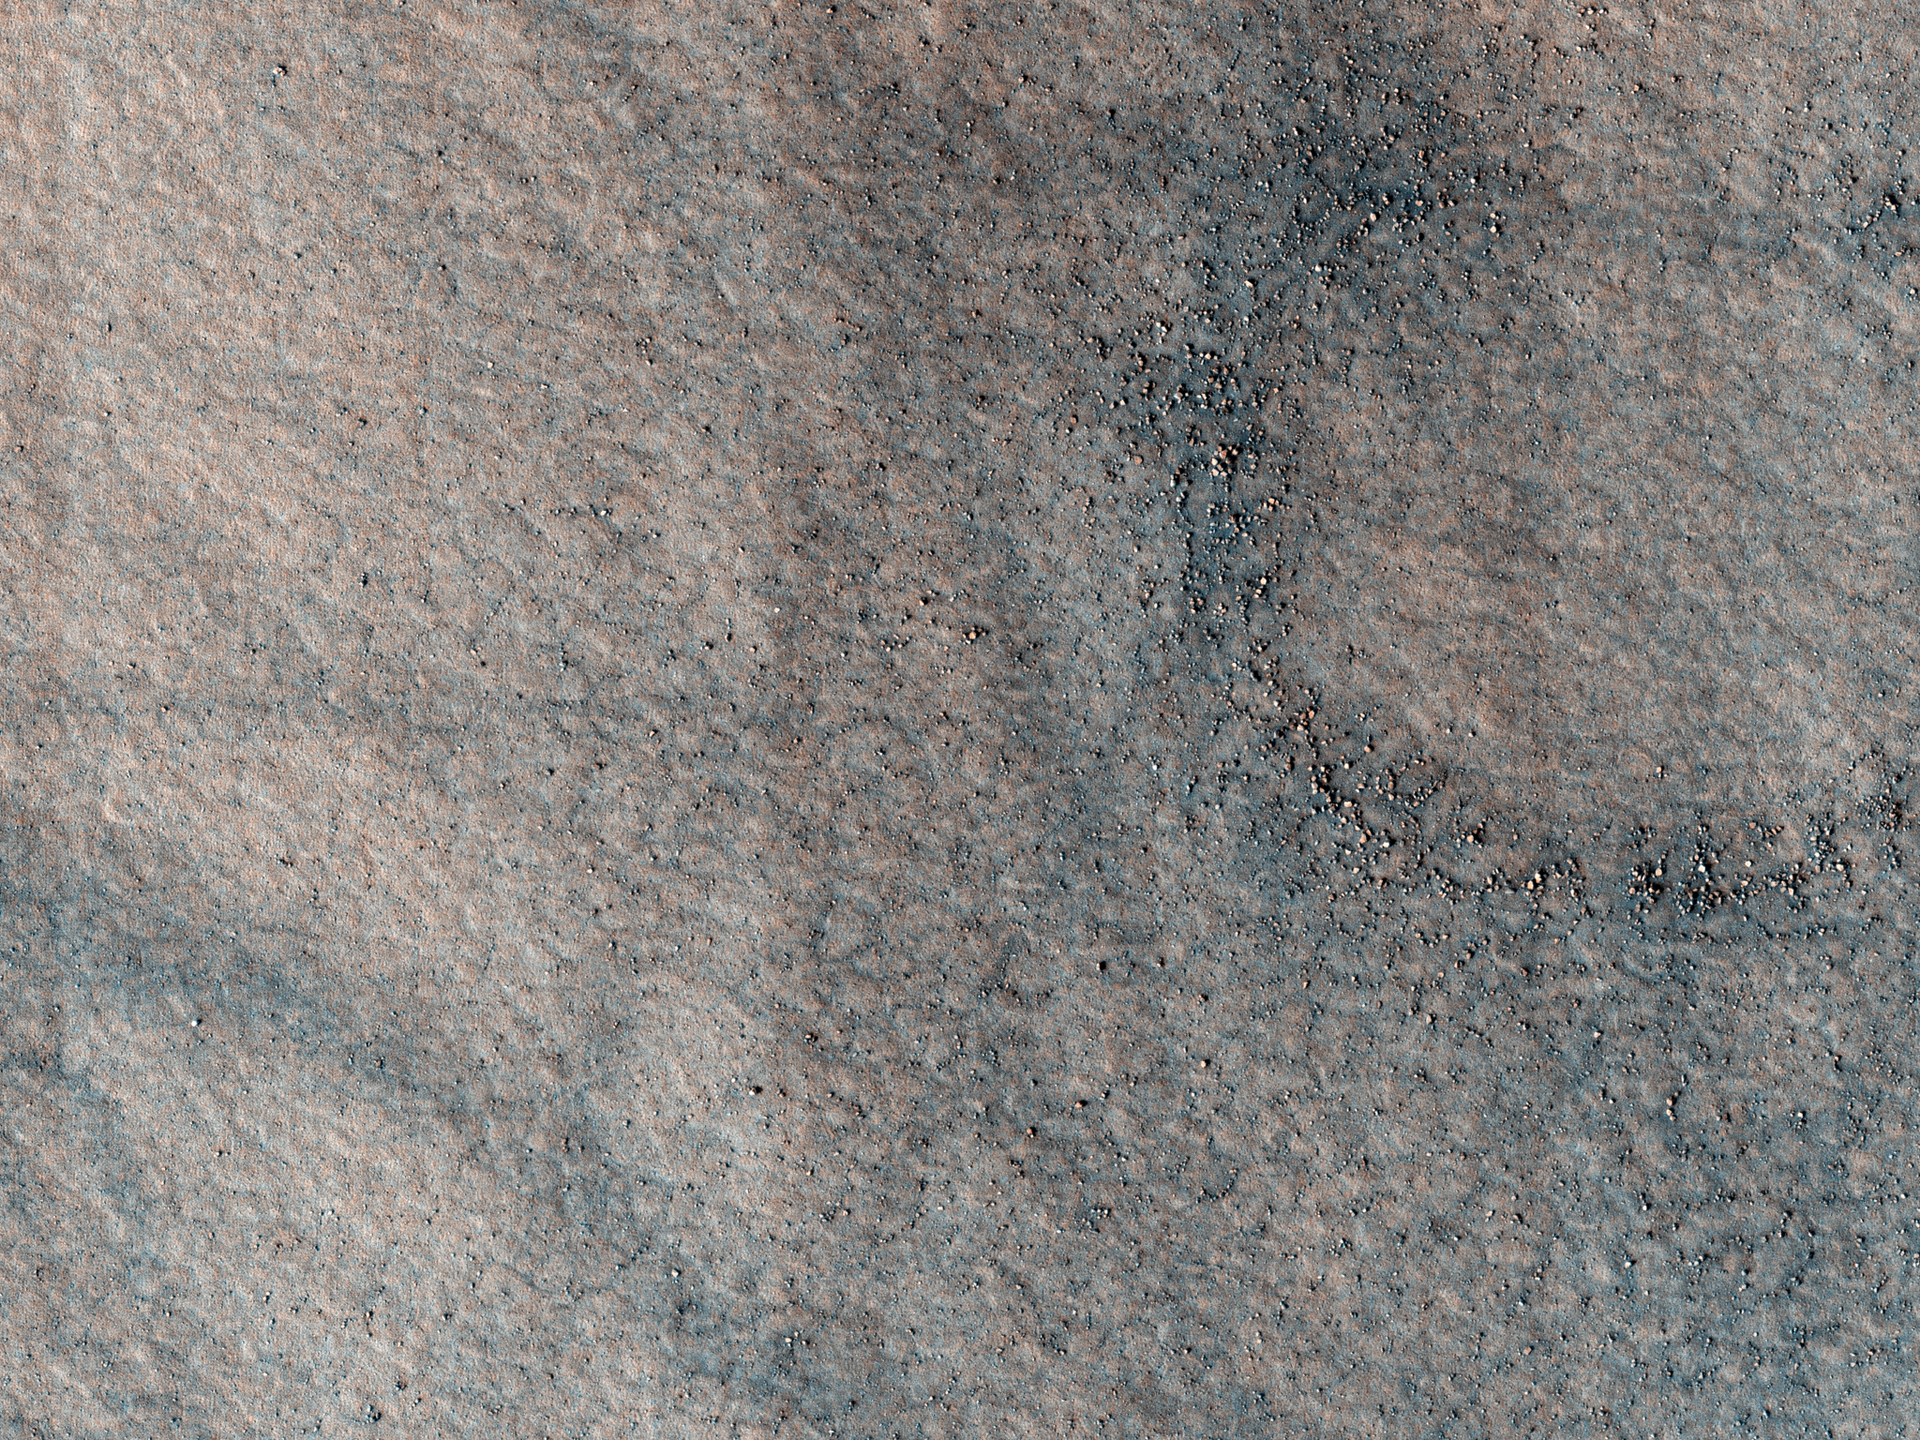
ADDITIONAL INFORMATION B&W label Color label Merged IRB label Merged RGB label EDR products HiView NB IRB: infrared-red-blue RGB: red-green-blue About color products (PDF) Black & white is 5 km across; enhanced color about 1 km For scale, use JPEG/JP2 black & white map-projected images USAGE POLICY All of the images produced by HiRISE and accessible on this site are within the public domain: there are no restrictions on their usage by anyone in the public, including news or science organizations. We do ask for a credit line where possible: NASA/JPL-Caltech/UArizona POSTSCRIPT NASA’s Jet Propulsion Laboratory, a division of the California Institute of Technology in Pasadena, Calif., manages the Mars Reconnaissance Orbiter for NASA’s Science Mission Directorate, Washington. The HiRISE camera was built by Ball Aerospace and Technology Corporation and is operated by the University of Arizona. |
|
Home About Catalog Outreach Science Updates Anaglyphs DTM HiView HiWish Map Press Science Nuggets Special Releases Stereo Pairs HiKERs |
Advanced Search Captions Contact FAQ Image Usage Policy 4 Q&A HiCards HiClips HiFlyers HiPOD Made with HiRISE MarsPoetica Social Media Map The BeautifulMars eBook Series The BeautifulMars Podcast Our Volunteers |
Camera Specs CTX Directory PDS Directory Science Themes Software Lunar & Planetary Laboratory PIRL College of Science University of Arizona MRO NASA/JPL Planet Four |
High Resolution Imaging Science Experiment HiRISE Operations Center 1541 E. University Blvd Tucson, Arizona 85721 © 2026 Arizona Board of Regents University Information Security and Privacy |